Pulmonary stereology in chronic obstructive pulmonary disease: pulmonary functional imaging examination
Hernández-Morales, Aloisia Paloma1; Robles-Hernández, Robinson Emmanuel1; Vázquez-García, Juan Carlos1
Hernández-Morales, Aloisia Paloma1; Robles-Hernández, Robinson Emmanuel1; Vázquez-García, Juan Carlos1
ABSTRACT
Computed tomography images are increasingly used in order to characterize lung diseases more accurately. A good correlation with lung function has been described, especially in chronic obstructive pulmonary disease. Spirometry is currently the gold standard for chronic obstructive pulmonary disease diagnosis, but computed tomography has been positioned to identify early disease and to identify progression in established disease. In the last decade, the functional evaluation of chronic obstructive pulmonary disease by computer tomography has improved diagnostic certainty, evaluation and prediction of progression. Moreover, it allows selecting patients for therapeutic interventions. Multiple metrics are used as prognostic-related imaging biomarkers in chronic obstructive pulmonary disease and have been correlated with respiratory function tests. This review aims to analyze the current and future role of CT in COPD.KEYWORDS
stereology, chronic obstructive pulmonary disease, spirometry, computed tomography.Abbreviations:
Introduction
In middle-income countries, a prevalence of chronic obstructive pulmonary disease (COPD) of 8 to 13% has been described among adults aged 30 to 79 years and older.1 The Latin American Project for Research on Chronic Obstructive Pulmonary Disease (PLATINO) described a prevalence of COPD of 7.8 to 20.0%, more frequent in men and at older ages, as well as in people with low educational level, low body mass index and exposed mainly to tobacco. Worldwide, there is a wide variation in diagnosis, with 10-95% underdiagnosis and 5-60% overdiagnosis.2 By 2030, it will be the seventh leading cause of disability-adjusted life years (DALYs) worldwide. Costs attributable to the disease are primarily associated with the number of exacerbations; in the United States, the direct costs of COPD are estimated at $50 billion in direct health care expenditures.3
COPD is a complex and heterogeneous condition, characterized by chronic and irreversible obstruction to expiratory airflow, due to the combination of airway remodeling and pulmonary emphysema. The genesis of the disease is influenced by genetic factors, such as hereditary alpha-1 antitrypsin deficiency, matrix metalloprotease deficiencies, childhood disadvantage factors, as well as exposure to occupational, atmospheric or indoor pollutants.4
The evaluation and follow-up of COPD is done both by clinical parameters and by respiratory function tests (RFTs). Recently, the improvement in the quality of tomographic imaging and in the quantification of volumetric parameters related to emphysema and airway damage allow a better complementary assessment, which can be used for early diagnosis and follow-up purposes. The present review aims to describe the current status of information related to functional imaging and RFTs, as well as their future prospects for clinical use in the characterization of COPD.
Diagnosis and functional assessment of COPD
The current diagnosis of COPD is considered a construct that integrates causes or risk factors, persistent respiratory symptoms and the presence of non-reversible airflow obstruction defined by a ratio < 0.7 between forced expiratory volume and forced vital capacity (FEV1 and FVC).5,6 However, these criteria may be modified in the future; several cohorts of patients who do not meet the definition of obstruction show loss of lung function and associated increased morbidity.7
While spirometry describes airflow limitation, additional RFTs can be incorporated, such as measurement of: static volumes by plethysmography, diffusing capacity of the lungs for carbon monoxide (DLco), six-minute walk (6MW) and impulse oscillometry (IOS), which can be useful in staging the disease and tailoring medical treatment to the needs of a heterogeneous population. Plethysmography can demonstrate air trapping and pulmonary hyperinflation, manifested by reduced inspiratory capacity (IC) and inspiratory reserve volume (IRV) with increased total lung capacity (TLC) and residual volume (RV). These indicators define pulmonary hyperinflation and air trapping, the loss of elastic recoil and the load to be broken by the respiratory muscles.8 In addition, it is related to mortality and exacerbations, may be an indicator for volume reduction surgery, especially for IC, and the RV/TLC ratio.9,10
In principle, a decreased DLco is an indicator of emphysema and may be due to a fall in alveolar volume (AV), mainly due to obstructive defects and/or emphysema, with a fall in the carbon monoxide transfer coefficient (KCO).11 A DLco value < 60% is associated with decreased exercise capacity, risk of death regardless of the degree of obstruction, and may represent a small group with precapillary pulmonary hypertension.12 In smokers without obstruction, a value < 80% predicts an increased risk of developing COPD.
The IOS application provides detailed information on airway properties, estimates respiratory system resistance (Rrs) and respiratory system reactance (Xrs). The findings in COPD consist of an increased Rrs and a decreased Xrs value.13 These findings are suggestive of small airway obstruction and, more importantly, correlate with the severity of obstruction at this level.
The 6MW is a submaximal exercise test. It is a sign of functional capacity in relation to exercise. It can indirectly show maximal oxygen consumption and is considered more representative of patients' daily activity. A reduced distance is an adequate index of functional disability and increased risk of mortality,14 although the prediction of hospitalization for exacerbation is unclear.
Tomographic evaluation
In 1970 Hounsfield developed computed tomography (CT) for clinical use. Emphysema was described by tomography in the late 1970s and early 1980s. Previously, histologic and postmortem studies were required to evaluate pulmonary structural changes. The introduction of CT made it possible to visualize the thorax and lung structure noninvasively. In 1978, Rosenblum et al. described the areas of low attenuation and average lung density in patients with a clinical diagnosis of COPD.15
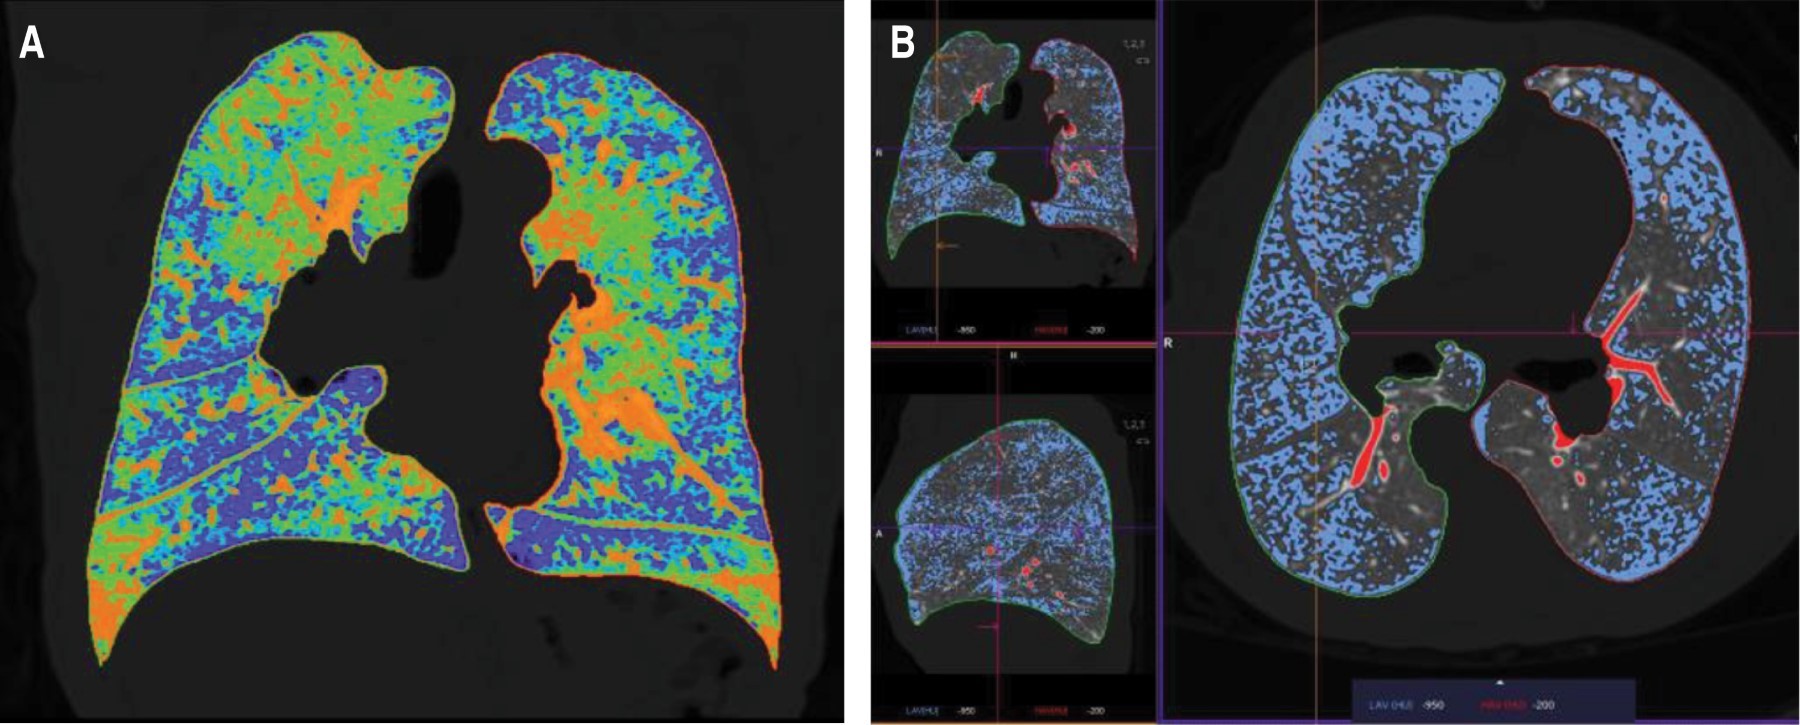
The need to understand the pathophysiological process of COPD translates into the need to quantify parenchymal and airway damage as a means to closely relate physiological alterations and clinical manifestations. Stereology (spatial interpretation by sections) is the quantification of lung volume by imaging and was initially used in histopathology to be adopted later to quantitative analysis by tomography, to the analysis of normal lung and then expanded to the field of COPD, to provide numerical information of emphysema, and development of a visual stratification system by estimating the number of axial tomography slices, which showed a strong association with airflow obstruction and histological specimens. Subsequently, automated techniques were developed to segment the lung parenchyma and quantify emphysema. The two main techniques initially described used the principle where emphysematous regions are represented by areas of low attenuation: the first method is called tomographic densitometry and the second, percentile densitometry, involves the choice of an average distribution curve, which provides the density in Hounsfield units (HU) under which a percentage of voxels are distributed (Figure 1).15 The Radiological Society of North America has promoted the standardization of lung densitometry for COPD within the framework of the Quantitative Imaging Biomarkers Alliance® (QIBA®).16
Physiopathogenesis and association with imaging
Quantitative histological assessment of the diseased lung, as well as improved lung imaging (such as CT) and a growing understanding of inflammation, cell signaling and cell death, among others, have provided a major step forward in the understanding of COPD. In this context, the determination of lung volumes is a key parameter in pulmonary stereology to properly interpret quantitative damage. Hogg et al. in 1968 provided key physiological data supporting that the main site of increased airway resistance in COPD was the small airways, in the range of 2 mm in diameter,16 the authors concluded that increased lung resistance could be due to obstruction of the small airways by mucus, narrowing or occlusion by fibrosis, as confirmed by Thurlbeck.17 The pathogenesis of increased lung volume and pathophysiology of increased small airway resistance includes that related to the cellular inflammatory process and mediated by innate and adaptive immunity. This inflammation persists for several years even after smoking cessation, suggesting self-perpetuating mechanisms.
There is a strong correlation between quantitative assessment of tomographic density and pathologic quantification. The percentage of low attenuation areas by CT are related to the FEV1/FVC ratio. This shows that smokers with normal spirometry, but with abnormal CT findings, such as emphysema, may have potential to develop airway obstruction in the future, compared to non-smokers.18 It has been demonstrated with the use of CT for histopathological specimen analysis (microCT) that the number of terminal and transitional bronchioles is reduced by up to 40% in mild to moderate COPD and up to 80% in severe disease. These findings suggest that this airway represents a "silent area" within the lung where damage can accumulate unnoticed.19 Resistance to small airway airflow is the main site of obstruction in COPD patients and precedes the onset of emphysematous destruction in COPD phenotypes with centrilobulbar and paraseptal emphysema. Small airways (smaller than 2 mm) cannot be directly visualized using CT scans; therefore, the finding of air trapping, which is seen as decreased lung attenuation on expiratory CT, can be used as an indirect sign of small airway dysfunction in COPD, and can also be quantified volumetrically; this finding is thought to be caused by early collapse of the small airways on exhalation.
Correlation between the extension of emphysema and functional parameters
Visual and subjective assessment of emphysema using CT with contiguous 10 mm thick slices began in 1986; significant correlations were observed between CT visual scores and macroscopic emphysema. Using visual pulmonary assessment, emphysema severity correlates fairly well with physiologic parameters (FEV1 and FEV1/FVC) and GOLD stage. The correlation coefficient ranges from 0.67 (for GOLD stage) to -0.74 (for FEV1/FVC). In particular, the range of the correlation coefficients is similar to the correlations between the extent of emphysema on quantitative CT (QCT) and each physiological parameter (0.62 for GOLD stage and -0.70 for FEV1/FVC).16 However, agreement among readers regarding the severity of emphysema on visual assessment tends to be variable, so quantitative CT is preferred for assessing emphysema severity. In addition, CT measurements have been shown to correlate better with macroscopic measurement of emphysema. Table 1 shows the relationships between tomographic parameters and RFTs.
Regional heterogeneity of emphysema
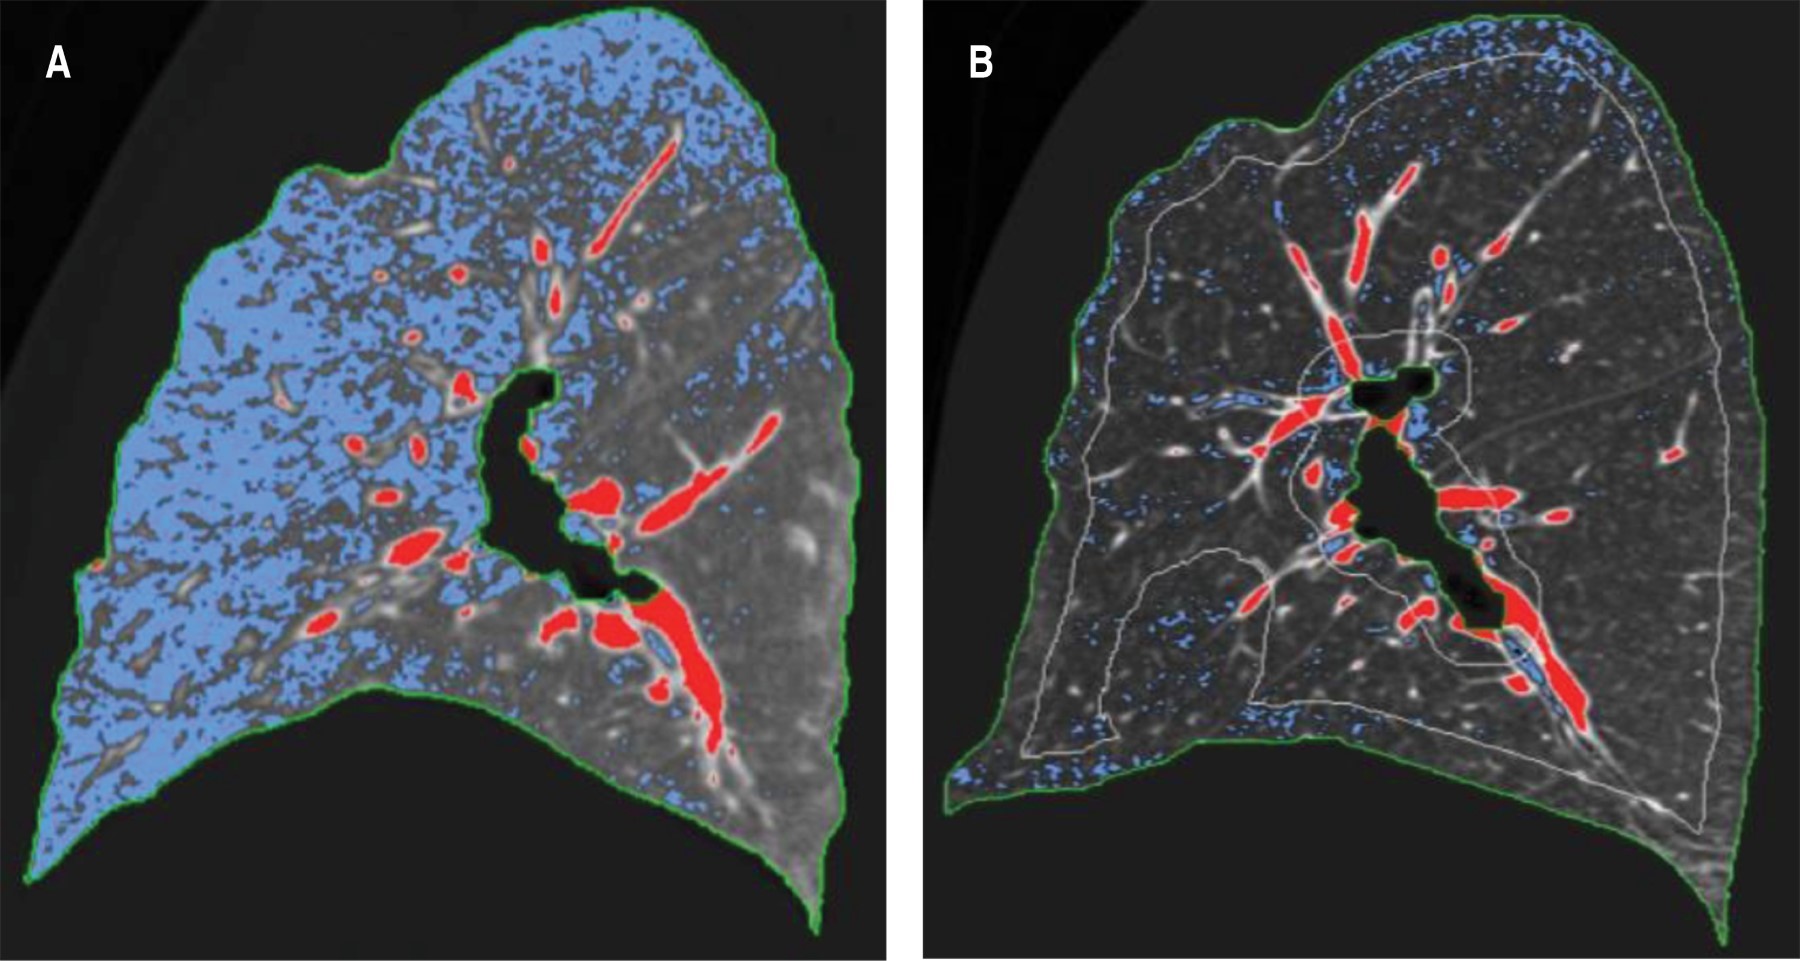
The basal distribution of emphysema is associated with major alteration of FEV1, but with less alteration of gas exchange (PaO2) and alveolar-arterial oxygen gradient, compared with the apical distribution of emphysema.16 Areas of emphysema on CT are more frequently found in the central areas of the lung than in the distal areas, and the extent of central and lower emphysema correlates much more with airflow limitation compared with distal emphysema (Figure 2).
Correlation between airway measurements and functional parameters
Many studies have shown that patients with higher percent wall area (%WA) have lower FEV1 expressed as a predicted percentage. The %WA has been considered the most commonly employed metric for clinical research, and there are modest correlations between it and pulmonary physiologic impairment. Moderate correlations have been described between airway wall measurements and airflow obstruction (FEV1 and FEV1 as percent predicted) and stronger correlations are observed when only small airways are analyzed. Relative volume change (RVC) is the parameter that shows that air trapping can be quantified based on the relative lung density in expiration and inspiration, thus expressing the actual degree of air trapping as the difference of the relative percentage of the thresholds in inspiration (-950 HU) and expiration (-860 HU).
Other methods are the air trapping index, which includes the ratio of expiratory to inspiratory lung volume (E/I-LV ratio) and the expiratory to inspiratory ratio of mean lung density (E/I-MLD ratio). E/I-MLD correlates with COPD clinical parameters such as BODE index (r 0.48 - 0.68) and E/I-LV shows a very high correlation with E/I-MLD (r = 0.95, p < 0.001).16
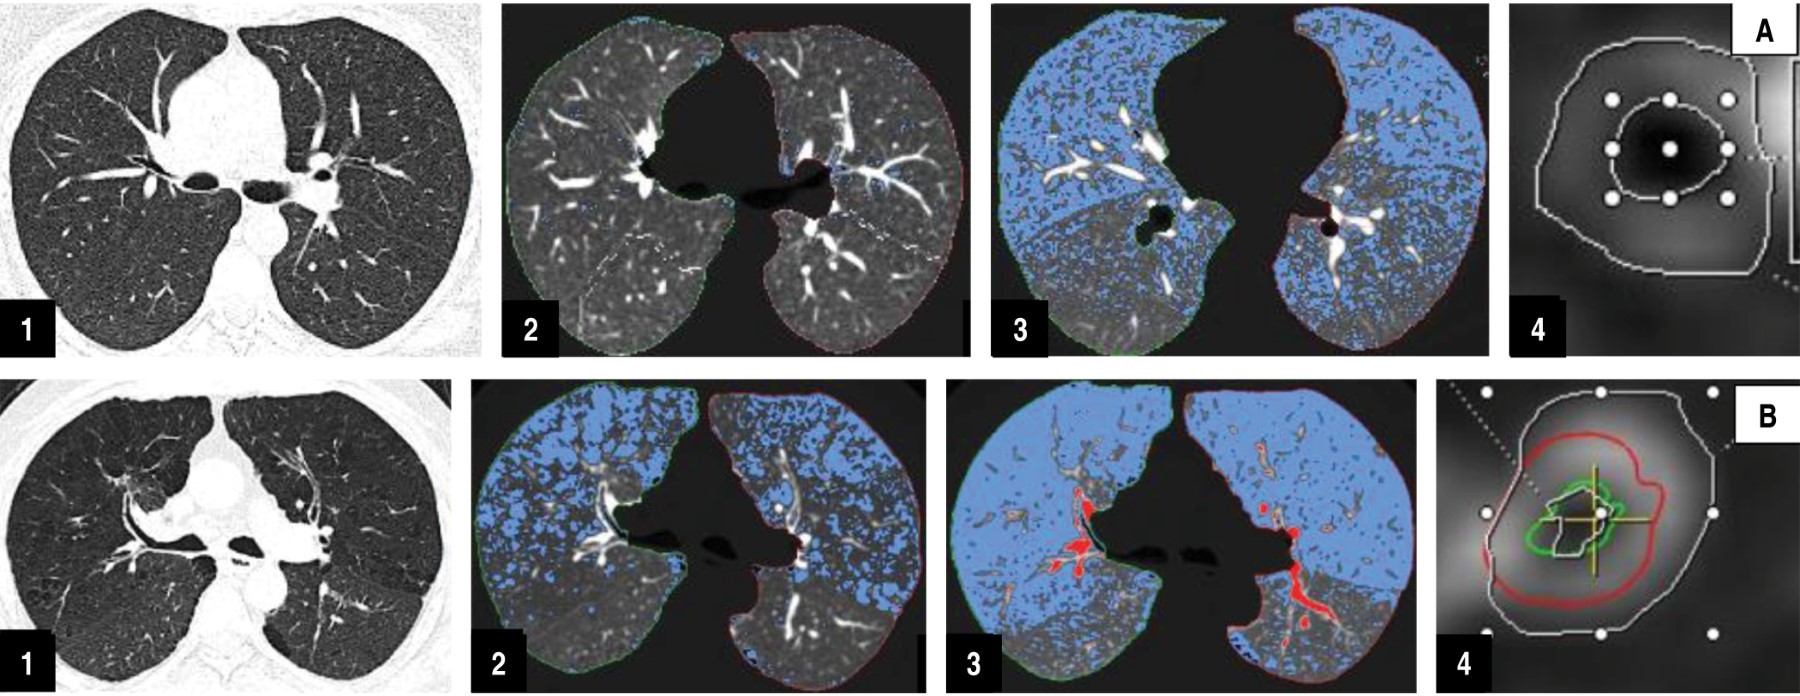
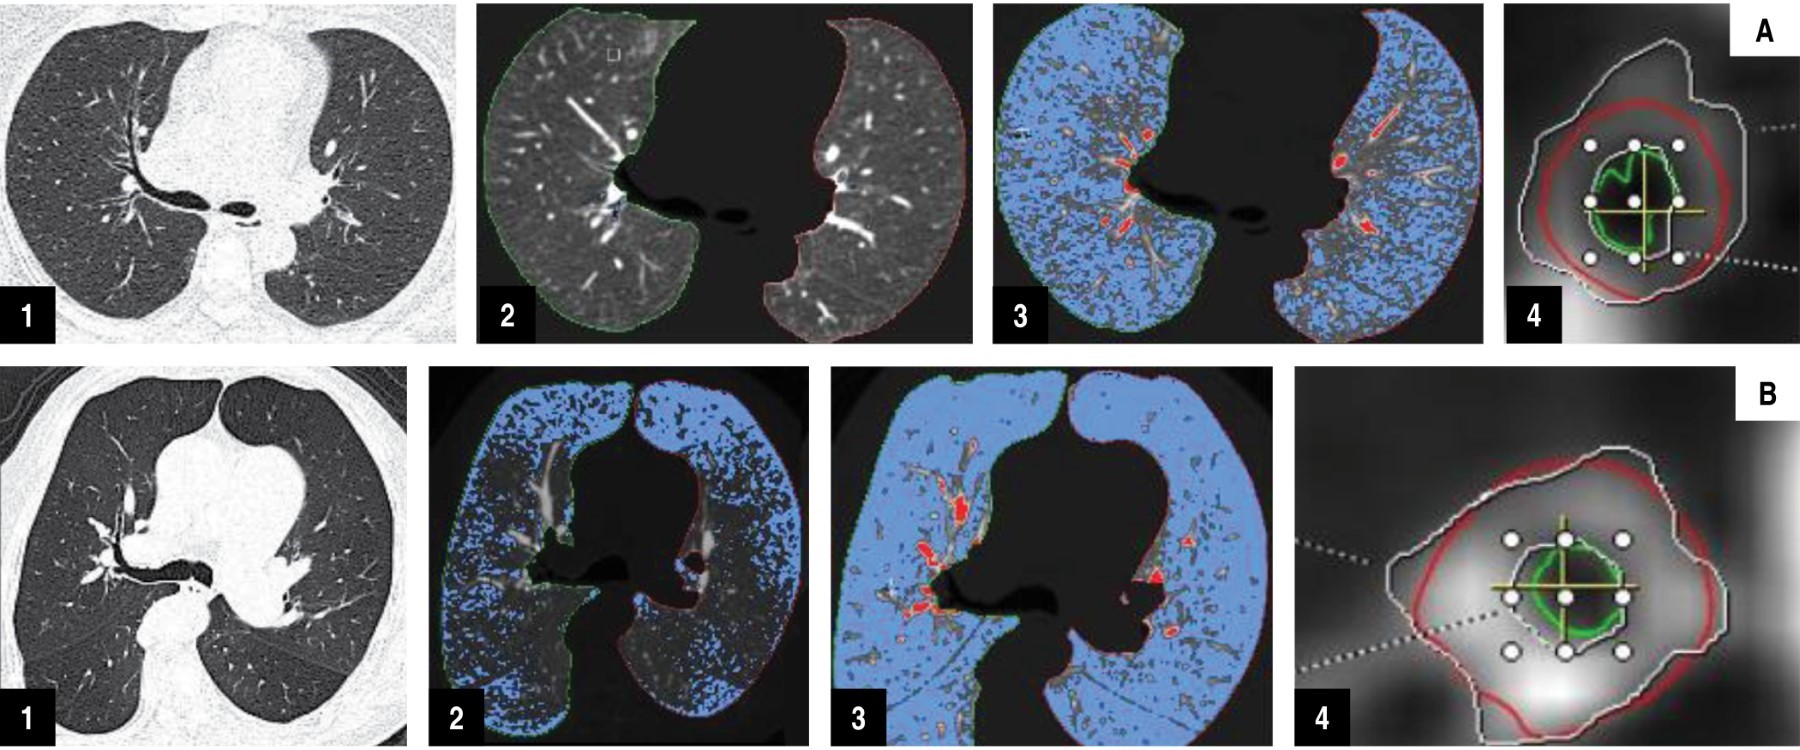
Other evidence has found small airway dysfunction, related to the degree of trapping and the percentage of damage on the parametric map (Figures 3 and 4); small airway dysfunction as assessed by IOS parameters in COPD patients is present in all exacerbations of the disease, particularly in GOLD patients 3-4. Compared to patients with normal IOS parameters, patients with abnormalities in IOS parameters have more respiratory symptoms, more severe airway obstruction, and structural abnormalities on imaging.15
Other imaging methods
Magnetic resonance (MR) imaging can provide functional information using perfusion and ventilation techniques in patients with COPD; with the MR perfusion technique, pulmonary blood flow can be quantitatively assessed. Perfusion alterations in COPD often show a low degree of inhomogeneous contrast enhancement, especially in areas of severe emphysema and with decreased peak signal intensity. In patients with severe emphysema, visual assessment of perfusion by 3D MRI shows high concordance with parenchymal destruction. Quantitative analysis confirms decreased perfusion parameters and correlates with worsening FEV1/FVC and increased CT emphysema index. Perfusion MRI in COPD shows reduced value and heterogeneous change in mean pulmonary blood flow (MBF), pulmonary blood volume (PBV) and mean transit time (MTT) compared to normal volunteers. Other advances in magnetic resonance imaging are those assessed by hyperpolarized gases, such as helium and xenon, which are expressed by ventilatory defects and can be quantified through the apparent diffusion coefficient (ADC) expressed in percentages; these ADC ventilatory defects correlate significantly with lung function tests (FEV1, FEV1/FVC and DLco).16
Dual-energy computed tomography, another imaging technique for the evaluation of COPD patients, shows that anatomical changes influence alveolar gas exchange and pulmonary blood flow. Pulmonary blood volume, assessed by this technique can be used for pulmonary perfusion assessment as a surrogate for dynamic CT-derived pulmonary blood flow; a simpler protocol that maintains quantitative similarity.
Dynamic perfusion imaging with multidetector CT can also provide regional perfusion. Smokers with subtle findings of centrolobulillar emphysema on CT and normal spirometry have been shown to have increased regional heterogeneity of lung perfusion compared with never-smokers and smokers with normal CT imaging. This technique requires a central bolus of high-pressure contrast material and scans a limited axial extent of the lung during a synchronized cardiac scan.
Xenon is a radiopaque gas and its concentration in the alveolar space can be measured as a function of CT image attenuation changes. Due to variability in baseline lung attenuation, between images due to misregistration artifacts and different levels of respiration, accurate measurement of lung ventilation function is limited. Two stable gases, xenon and krypton, with high atomic numbers (54 and 36, respectively) are eligible for dual-energy CT ventilation imaging. For xenon ventilation imaging with dual-energy CT, the patient generally inhales stable xenon at a concentration of 30% (mixture of 30% xenon and 70% oxygen) for 1 min to 1 min and 30 seconds and with the use of a xenon gas inhalation system.
Regional ventilation and perfusion can also be assessed with positron emission tomography (PET), using 13N2 isotope as a gas dissolved in saline. Spatial heterogeneity of lung perfusion has also been described with 13N2-saline PET, and regional heterogeneity in perfusion has been increased in patients with mild COPD compared with healthy controls, after adjusting for regional changes in lung tissue density and ventilation. These results suggest that regional perfusion changes may precede lung parenchymal destruction in COPD. Therefore, this imaging method may serve as an early biomarker.
Conclusions
There is an adequate correlation of PFT and quantitative assessment by CT, as well as other imaging techniques. This has allowed to broaden the knowledge of the pathophysiological process; its multiple metrics show usefulness for the detection of initial findings in early COPD. Furthermore, CT imaging with parametric mapping is emerging to improve the diagnosis and allow the follow-up of this type of patients, as well as for the implementation of early therapeutic strategies.
AFILIACIONES
1Instituto Nacional de Enfermedades Respiratorias Ismael Cosío Villegas. Mexico City, Mexico.Conflict of interests: the authors declare that they have no conflict of interests.
REFERENCES
Adeloye D, Song P, Zhu Y, Campbell H, Sheikh A, Rudan I; NIHR RESPIRE Global Respiratory Health Unit. Global, regional, and national prevalence of, and risk factors for, chronic obstructive pulmonary disease (COPD) in 2019: a systematic review and modelling analysis. Lancet Respir Med. 2022;10(5):447-458. doi: 10.1016/s2213-2600(21)00511-7.
Torres-Duque C, Maldonado D, Pérez-Padilla R, Ezzati M, Viegi G; Forum of International Respiratory Studies (FIRS) Task Force on Health Effects of Biomass Exposure. Biomass fuels and respiratory diseases: a review of the evidence. Proc Am Thorac Soc. 2008;5(5):577-590. doi: 10.1513/pats.200707-100rp.
Washko GR, Martinez FJ, Hoffman EA, Loring SH, Estépar RSJ, Diaz AA, et al.; National Emphysema Treatment Trial Research Group. Physiological and computed tomographic predictors of outcome from lung volume reduction surgery. Am J Respir Crit Care Med. 2010;181(5):494-500. doi: 10.1164/rccm.200906-0911oc.
Oostveen E, MacLeod D, Lorino H, Farré R, Hantos Z, Desager K, et al.; ERS Task Force on Respiratory Impedance Measurements. The forced oscillation technique in clinical practice: methodology, recommendations and future developments. Eur Respir J. 2003;22(6):1026-1041. doi: 10.1183/09031936.03.00089403.


|
Table 1: Application of respiratory function tests in COPD and their relationship with parametric mapping computed tomography. |
||
|
Test |
Clinical outcomes of PFTs |
Correlation with CT |
|
Body plethysmography |
CI, increased RV/CPT indicate increased dyspnea, risk of death and may be indicative of volume reduction surgery when severe hyperinflation is present |
The ITGV and percentage predicted CPT have a positive correlation (R2 0.33) with the percentage of emphysema, with an AUC of 0.79, indicating hyperinflation |
|
Carbon monoxide diffusion |
A DLco with values < 60% is associated with decreased exercise capacity and risk of death. Decreased in precapillary pulmonary hypertension. In non-obstructed values < 80% predict a risk of developing COPD |
A percentage of predicted decreased KCO and DLco have a positive correlation with the percentage of emphysema especially when greater than 10% with AUC of 0.78 |
|
Oscillometry |
IOS is more sensitive than spirometry in identifying peripheral airway pathology. In addition, in COPD patients with FEV1 < 50%, Xrs is a very sensitive indicator of exacerbations and mortality |
IOS analysis especially an R5-R20 index > 0.07 kPa has a positive correlation (r2 = 0.599) with small airway disease related to air trapping (OR 2.01) identifying early disease |
|
6 min walk |
Reduced distance at 6MW indicates functional disability and increased risk of mortality |
The 6-minute walk has a positive correlation with the severity and percentage of emphysema (r = 0.55) |
|
Other spirometry values or indexes |
FEV1/FEV6 is simple, has good sensitivity, specificity and is a good predictor of exacerbations. FEV3/FEV6 values below LLN are associated with poor quality of life, exacerbations and obstruction. Useful for early diagnosis |
FEV1/FEV6 increased gas trapping and airway wall thickness FEV3/FEV6 has a good correlation with small airway disease and emphysema |
|
PFT = pulmonary function tests. AUC = area under the curve. IQ = inspiratory capacity. TLC = total lung capacity. 6MW = 6-minute walk. DLco = diffusing capacity of the lungs for carbon monoxide. COPD = chronic obstructive pulmonary disease. FEV1 = forced expiratory volume in the first second. FEV3 = forced expiratory volume at second 3. FEV6 = forced expiratory volume at second 6. KCO = Korgh’s constant. kPa = kilopascals. LLN = lower limit of normal. OR = odds ratio. R5 = total resistances. R20 = central resistances. Xrs = reactance area. ITGV = intrathoracic gas volume. RV = dual volume. |
||


