Introduction
Extracorporeal life support (ECLS) encompasses a set of devices capable of mechanically assisting cardiac and pulmonary functions either temporarily or for prolonged periods1. Among these, extracorporeal membrane oxygenation (ECMO) therapy emerged as an initially respiratory support option in the 1970s, however, today this mechanical device has the capability to assist patients with both refractory acute respiratory failure and circulatory failure unresponsive to optimal conventional management. Upon initiating ECMO therapy, medical management that causes greater patient harm can be modified, such as reducing high doses of vasopressors and inotropes or safely modifying mechanical ventilation parameters to maintain lung protection goals2,3. The overall management of patients on ECMO differs profoundly from conventional critical care; a deep understanding of cardiopulmonary physiology and pathophysiology, as well as ECMO physiology, is required to achieve an optimal balance between oxygen supply and consumption and to maintain organ perfusion to achieve the desired recovery. The purpose of this review is to describe these basic principles for understanding ECMO therapy and also to present blood gas analysis as a hemodynamic monitoring tool that provides variables linked to cardiac output (CO), microcirculation, oxygenation, and metabolism, in addition to helping distinguish the proportional contribution of the oxygen delivery from circulatory support and from the patient, allowing for a more accurate assessment of tissue perfusion.
Cardiopulmonary physiology and pathophysiology
The cornerstone of adequate metabolic function is oxygen, which, when combined with certain substrates, produces energy and heat, releasing metabolites such as carbon dioxide (CO2) and water. Therefore, the relationship between general metabolism and oxygen consumption (VO2) is close; the oxygen consumption rate of an adult at rest is 120 ml/min/m2 (in children, 4-5 ml/kg/min)4 (Fig. 1). Metabolic requirement can increase or decrease depending on the patient’s clinical situation; fever, certain drugs, and hormones increase oxygen consumption, and situations such as hypothermia, sedation, and paralysis decrease it5. When the metabolic rate increases, oxygen requirement also increases, and in this case, ideally, oxygen availability should increase. Oxygen in blood travels bound to hemoglobin (Hb) and dissolved in plasma. The arterial oxygen content (CaO2) can be calculated through blood gas analysis as follows:
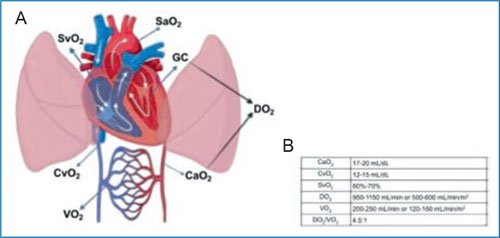
Figure 1. A: representation of oxygen delivery (DO2) and oxygen consumption (VO2). B: reference values. CaO2: arterial oxygen content; CvO2: venous oxygen content; CO: cardiac output; SaO2: arterial oxygen saturation; SvO2: venous oxygen saturation.
Each gram of fully saturated Hb carries 1.34 ml of oxygen. Additionally, oxygen dissolved in plasma can be estimated considering that for each mmHg of partial pressure of oxygen (PaO2), 0.0031 ml of oxygen dissolves per deciliter of blood. However, this fraction contributes a minimal amount, and so, it is often omitted in the CaO2 calculation.
Of these variables, the most important is Hb, which transports 99% of oxygen to the body; therefore, venous oxygen content (CvO2) can also be calculated using a central or mixed venous blood gas analysis. The total oxygen delivered to the tissues, known as oxygen delivery (DO2), is calculated by multiplying CaO2 by CO6. DO2 in healthy subjects is usually 4-5 times greater than VO2, but in critically ill patients, the relationship is substantially altered; a DO2:VO2 ratio of 2:1 has been identified as the critical point for anaerobic metabolism, and therefore, in critically ill patients, it is recommended to maintain DO2 at least 3 times greater than VO27.
In an acute event, the body cannot increase Hb or oxygenation, and therefore, CO becomes the primary determinant of DO2. CO will increase to compensate for the alteration in the DO2:VO2 ratio caused by an initial decrease in DO2 or an increase in VO2. This is maintained until the critical point is reached, as shown in figure 2, at which anaerobic metabolism intensifies, leading to elevated lactate and other metabolite production. If this persists, acidosis, irreversible cell injury, and multiple organ failure will develop8.
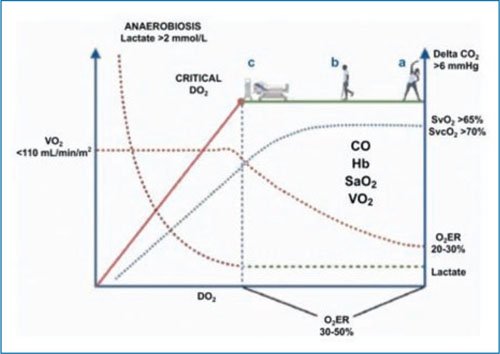
Figure 2. Schematic representation of the relationship between oxygen delivery and oxygen consumption (DO2:VO2). Under the assumption that the alteration is in DO2, the green zone represents the optimal point of the DO2:VO2 relationship, with person a being a healthy individual with adequate balance. Person b presents a reduction in DO2, which may be due to some chronic conditions such as heart failure, pulmonary disease, or anemia, with a narrower DO2:VO2 relationship, but without hypoperfusion. Person c is a critically ill individual with an acute condition that alters the DO2:VO2 relationship. Without appropriate intervention, the patient will progress to the red point, known as the critical point, with a sloped zone where VO2 becomes dependent on DO2 and the oxygen debt develops; if intervention does not occur at this point, cellular injury and multiorgan failure will occur. The blue dotted line shows the behavior of venous oxygen saturation (SvO2) with reduction when the DO2:VO2 relationship narrows, correlating with an increase in the oxygen extraction rate (O2ER). The green dotted line shows how lactate will have an abrupt increase from the critical point. The upper arrow indicates how the delta CO2 will increase when DO2 decreases secondary to low cardiac output (CO).
Regarding VO2, it is known that the consumption or production of a substance in a tissue can be calculated by knowing the concentration of the substance before entering the tissue, the concentration after passing through the tissue, and the rate of passage of the substance (blood flow). Therefore, global VO2 can be calculated by knowing CO, the oxygen content after pulmonary oxygenation (CaO2), and the oxygen content before it (CvO2), obtained through arterial and central or mixed venous samples, respectively, as follows9:
It should be noted that VO2 not only depends on the patient’s metabolic needs but can never be greater than DO2. Therefore, when DO2 falls excessively, VO2 becomes dependent on it, as shown by the solid red line in figure 2, where the relationship is linear; clinically, the patient may require greater VO2, but it cannot be achieved. This oxygen debt leads to irreversible mitochondrial injury, with subsequent apoptosis or necrosis10.
CO2 is a metabolite of carbohydrate degradation; specifically, it is released in the Krebs cycle, and in blood, it travels dissolved in plasma, bound to blood proteins (carbaminos), and as bicarbonate. Its blood concentration depends essentially on its production rate and elimination rates; a slight increase in its blood concentration can occur during fever, increased catabolism, and overfeeding, due to increased production11. Elimination depends on both alveolar ventilation and blood flow; without the latter, CO2 cannot be transported to the alveolus for exhalation. Under this concept, an elevation of CO2 can be due to hypoventilation or low blood flow and a decrease due to hyperventilation or high blood flow. Blood gas analysis of CO2 is useful for inferring CO if other causes of its alteration are ruled out, the most relevant being ventilatory; for this reason, it is analyzed with two blood gases: arterial and central venous. If the cause is ventilatory, venous and arterial CO2 will be modified proportionally, without having a difference greater than 6 mmHg (arteriovenous CO2 difference [DavCO2]), and if the difference is greater than 6 mmHg, it indicates low blood flow (macro- or microcirculatory) and correlates well with CO in shock states, whether cardiogenic or hypovolemic12.
The oxygen extraction ratio (O2ER) is the percentage of oxygen consumed by tissues from the total oxygen delivered, knowing that optimal DO2 should be 4-5 times greater than consumption, and therefore, adequate extraction should be around 20-25%, considering that a decrease in DO2 or an increase in VO2 leads to an increase in O2ER (50% would equal a DO2/VO2 ratio of 1:2). This can be calculated using any of the following formulas:
This is the principle by which central venous saturation is widely used as a marker of O2ER and the DO2/VO2 ratio. As long as the variables influencing oxygen dissociation from Hb are not altered and SO2 by pulse oximetry is at 94-97%, the formula 100 – SvO2 is reliable for determining DO2/VO2 ratio13,14.
Therapeutic strategies
When a DO2/VO2 ratio imbalance is detected by any of the previous methods, it must be corrected promptly to prevent irreversible injury. When DO2 is low, it may be due to a drop in any of its determinants (CO, Hb, or oxygenation). If oxygenation and Hb are within normal ranges (SaO2 94-97% and Hb 7-9 g/dl), then measures will be taken to improve CO through volume infusion, inotropes, or afterload reduction, depending on the clinical context. Excessive VO2 is usually due to fever, significant respiratory effort, seizures, or pain. In such cases, appropriate measures include administering antipyretics, adjusting mechanical ventilation, providing sedation and neuromuscular blocking agents if needed, and giving anticonvulsants.
Physiology in ECMO
In shock states or respiratory failure, the DO2:VO2 ratio may be close to 2:1 or lower; at this point, initiation of ECLS therapy is crucial. ECLS maintains the DO2:VO2 ratio close to the physiological state, allowing insufficient organs to be treated, recover, or be transplanted15. The ECMO circuit consists of extraction and return cannulas, tubing, a pump (usually centrifugal), and the oxygenator (artificial lung). During ECMO support, venous blood is drained from the right atrium through a cannula connected to a tubing system (3/8 in adults), constituting three main circuits: prepump, premembrane, and postmembrane. In the prepump circuit, pressure is ideally negative (not less than –60 mmHg, also known as negative venous pressure or P1), pumped through an artificial lung (oxygenator) passing through the premembrane circuit, where pressure becomes positive (P2), and returned to the aorta (VA-ECMO, venoarterial) or to the right atrium (VV-ECMO, venovenous) through the postmembrane circuit, where circuit pressure remains positive, but not greater than 300 mmHg (P3).
Blood flow through these cannula circuits may be limited primarily by the size of the venous extraction cannula. Flow resistance decreases with a larger internal diameter and a shorter catheter length, allowing a higher extracorporeal flow rate.
More simply, ECMO maintains the DO2:VO2 ratio by draining most of the venous blood. In the VA-ECMO configuration, blood flow is pumped through the oxygenator and back to the systemic circulation, bypassing the heart and lungs, where the artificial organ (oxygenating membrane) maintains cardiac function. In patients with respiratory failure configured with VV-ECMO support, blood flow is drained from the oxygenator to the right atrium, allowing previously oxygenated blood to be transported through the pulmonary circulation and subsequently to the systemic circulation. Figure 3 shows the components of ECMO, its different circuits in a VA-ECMO scenario, and the VV-ECMO configuration for respiratory failure management.
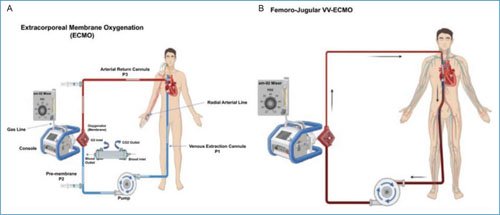
Figure 3. Graphical representation of conventional venoarterial (VA-ECMO) and venovenous (VV-ECMO) configurations. A: the blue line shows the extraction flow from the venous cannula placed at the cavo-atrial junction to the pump (centrifugal), which then passes to the oxygenator or membrane (premembrane circuit). The blood flow, after passing through the membrane (which provides oxygen and removes CO2), exits the membrane and returns through the postmembrane circuit to the aorta via an arterial cannula. The gas mixer regulates the level of inspired oxygen fraction and fresh gas flow. Sampling sites for gasometric monitoring are shown (premembrane, postmembrane, and peripheral arterial). B: femoro-jugular VV-ECMO configuration, with extraction cannula in the right femoral vein and blood flow return to the right internal jugular vein.
In ECMO, oxygen diffuses in the membrane through thousands of small tubes or hollow fibers that allow gas diffusion, but not liquids, through their walls into venous blood, increasing SaO2 from venous conditions with 75% saturation to 100% saturation. This blood oxygenation is controlled by the membrane’s diffusion surface area, venous saturation, contact time in the membrane, total amount of Hb, and blood flow16 (Fig. 4).
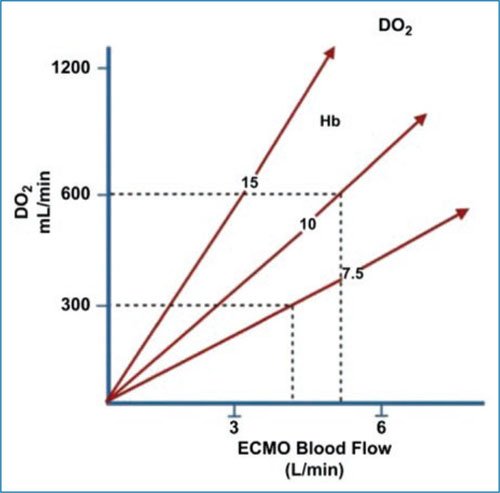
Figure 4. Graph showing that, since cardiac output (CO) is the main determinant of oxygen delivery (DO2), and since the patient’s total CO is the ECMO blood flow plus native venous return, increasing ECMO flow will result in a progressive increase in DO2. The amount of oxygen delivered per unit of flow depends on the amount of hemoglobin (Hb) in the blood (modified from McLaren et al.18).
Another important event during extracorporeal therapy is CO2 clearance, as in the normal lung, which is adjusted through ventilation gas flow. This is usually adapted at the same rate as blood flow at the start of support (subsequently adjusted with arterial gas samples). The CO2 transfer rate by the oxygenator is very efficient (despite having a lower diffusion gradient than oxygen, as it has a diffusion coefficient 20 times greater), and generally, low gas flows are required for its elimination. Increasing the gas flow has no effect on oxygenation. The amount of CO2 cleared by any membrane is calculated as the difference between the CO2 content entering the membrane and that exiting it. Thus, if the ratio between gas flow and blood flow is 1:1, similar to oxygen, or if the ratio is increased to 8:1, a greater difference and CO2 removal is achieved2,15,16.
Hemodynamic monitoring in ECMO with blood gas analysis
The basic principle of using ECMO as circulatory support in its basic VA-ECMO modality is to provide blood flow to replacethe patient’s native CO when it is insufficient to maintain adequate organ perfusion. With this premise, we consider that DO2 will be calculated from the blood flow provided by ECMO plus the patient’s native CO. The most common configuration of this modality is peripheral femoro-femoral, with a venous extraction cannula, with the tip located at the cavo-atrial junction, and an arterial return cannula, in the descending aorta. The extraction cannula directed to the cavo-atrial junction, by extracting blood, prevents all blood flow returning to the right atrium from passing entirely through the right chambers and pulmonary circulation; as a result, gas measurement at this level (before passing through the oxygenating membrane) provides information about blood oxygenation after perfusing tissues, so that it can be considered equivalent to taking a central venous blood sample and using it to calculate oxygen consumption from CvO2. In addition to calculating premembrane oxygen content (CvO2), for hemodynamic analysis by blood gas, postmembrane (CpO2) and patient (CaO2) oxygen contents must be calculated in samples taken at the points shown in figure 3A. Global or functional CO consists of two components: the flow provided by ECMO and the native CO. The ECMO does not require calculation, as the equipment’s flowmeter reports the exact amount provided. Regarding the second, some native CO is always present even in ventricular failure because a complete absence of native output would cause the aortic valve to remain closed, potentially leading to intracavitary thrombosis. For calculating this CO, conventional or transpulmonary thermodilution equipment is not accurate, as the extraction and return cannula will affect the temperature change of the liquid administered for measurement. Arterial line pulse contour analysis techniques are also not valid, due to the loss of pulsatility due to both ventricular failure and continuous blood flow provided by ECMO.
One method to calculate the total or effective CO using the gasometric workshop is by applying the following formula:
However, calculation by this method is also imprecise, as it depends on the modified Fick equation, which uses an estimated VO2. It is recommended to use the echocardiographic method for calculating native CO: through a parasternal approach, located between the second and fourth intercostal spaces with the transducer mark oriented toward the right shoulder, the left ventricular outflow tract (LVOT) is located and the diameter is measured about 5 mm to 1 cm before the aortic valve (AoV). The LVOT area is calculated using the formula A = πr2, and then, through an apical approach, in a five-chamber view (fifth intercostal space intersecting with the midclavicular line/anterior axillary line, with the transducer marker at the 3 o’clock position and with an inclination showing the LVOT and AoV), measurement is performed using pulsed-wave Doppler just 5 mm to 1 cm before the valve, thus obtaining flow in the LVOT. The contour of this flow is traced with an electronic pen, and the velocity-time integral is obtained. This value is then multiplied by the previously calculated LVOT area to obtain the stroke volume, which, when multiplied by heart rate, yields the native CO17. With the results of native CO, blood flow provided by ECMO, and the previously discussed oxygen contents, the hemodynamic workshop formulas are developed:
– Total CO (blood gas): ECMO flow × (CpO2 – CvO2/CaO2 – CvO2)
– Total CO: ECMO flow + native CO (calculated by echocardiography)
– Oxygen delivery (DO2): CaO2 × (total CO) × 10 (multiplied by 10 to convert liters to deciliters). Normal value approximately 1000 ml/min; indexed 520 to 570 ml/min/m2
– Oxygen consumption (VO2): (CaO2 – CvO2) × (total CO) × 10. Normal value approximately 200 ml/min; indexed 110 to 160 ml/min/m2
– DO2/VO2 ratio (desired in ECMO greater than 3:1)
– Membrane oxygen delivery: CpO2 – CvO2. Normal value 3-5 ml/dl; it is an indicator that the oxygenator is functioning properly
– O2ER: (DO2/VO2) × 100, (CaO2 – CvO2/CaO2) × 100, (SaO2 – SvO2/SaO2) × 100
– Native venous return (NVR): in a patient theoretically without significant shunts, venous return and CO are equal, so NVR equals native CO calculated by ultrasound. If CO was calculated with the blood gas formula, then NVR can be calculated as follows: total flow (Q) – ECMO flow. This value is relevant especially in patients requiring respiratory support, because if NVR exceeds the extraction cannula flow, it may cause hypoxemia (a greater volume of blood passes through diseased lungs). Normally, NVR ranges from 1.5 to 2 l/min.
Clinical cases
Clinical case 1
A 30-year-old male, weighing 79 kg and with a height of 170 cm, and a body surface area of 1.9 m2, diagnosed with acute respiratory distress syndrome due to pneumonia, receiving femoro-jugular VV-ECMO support on his fifth day of assistance. Table 1 shows the blood gas and hemodynamic workshop values.
Table 1. Hemodynamic and blood gas parameters of a patient on VV-ECMO
| Hb: 8.9 g/dl | CpO2 (postmembrane): 12.75 ml/dl |
| SaO2:95% | DavO2: 2.86 ml/dl |
| PaO2: 78 mmHg | O2ER: 25.5% |
| SvO2 (premembrane): 69% | CO (blood gas analysis): 6.16 l/min |
| PvO2: 40 mmHg | DO2: 689 ml/min |
| SaO2 (postmembrane): 100% | Oxygen delivery index (DO2I): 362.8 ml/min/m² |
| PaO2 (postmembrane): 277 mmHg | VO2: 176.17 ml/min |
| ECMO flow: 4 l/min | Oxygen consumption index (VO2I): 92.6 ml/min/m² |
| Lactate: 1.8 mmol/l | DO2:VO2 ratio: 3.9:1 |
| CO by echocardiography: 4.8 l/min | Oxygen transfer (membrane): 4.41 ml/dl |
| CaO2: 11.2 ml/dl | Native venous return: 2.16 l/min |
| CvO2 (premembrane): 8.34 ml/dl |
The patient is adequately supported, with appropriate SvO2, a lactate level < 2 mmol/l, normal oxygen difference (DAvO2), and DO2:VO2 ratio > 3:1. Although oxygen delivery is low in this patient, it is adequate, as the DO2:VO2 ratio is maintained, and there are no signs of poor perfusion or anaerobiosis. While under sedation, neuromuscular relaxation, and mechanical ventilation, his VO2 remains low. When initiating patient progression (discontinuation of relaxation and reduction of sedation), upon awakening and assisting his ventilations, his VO2 is likely to increase. In this scenario, DO2 may become insufficient. Therefore, to maintain the DO2:VO2 ratio, it may be necessary to increase ECMO blood flow or transfuse the patient.
Clinical case 2
A 49-year-old male, weighing 62 kg and measuring 164 cm in height, with a body surface area of 1.67 m2, in the postoperative period following Bentall-De Bono surgery, who developed postcardiotomy cardiogenic shock, supported with peripheral femoro-femoral VA-ECMO, currently on his second day of assistance. Table 2 shows the blood gas analysis data.
Table 2. Hemodynamic and blood gas parameters of a patient on VA-ECMO
| Hb: 9.3 g/dl | CvO2 (premembrane): 7.83 ml/dl |
| SaO2: 99% | CpO2 (postmembrane): 13.43 ml/dl |
| PaO2: 201 mmHg (right radial line) | DavO2: 5.13 ml/dl |
| SvO2 (premembrane): 62% | O2ER: 39.7% |
| PvO2: 33 mmHg | DO2: 557.28 ml/min |
| SaO2 (postmembrane): 100% | IDO2: 333.1 ml/min/m² |
| PaO2 (postmembrane): 312 mmHg | VO2: 220.59 ml/min |
| ECMO flow: 2.9 l/min | IVO2: 131.8 ml/min/m² |
| Lactate: 3.2 mmol/l | DO2:VO2 ratio: 2.5:1 |
| CO by echocardiography: 1.4 l/min | Oxygen transfer (membrane): 6.08 ml/dl |
| CO by Swan-Ganz: 1.6 l/min | Native venous return: 1.4 l/min |
| CaO2: 12.96 ml/dl |
The patient is under-supported, with low DO2 and a DO2:VO2 ratio < 3:1. Additionally, he presents decreased SvO2, increased DavO2 and O2ER, and lactate level > 2 mmol/l. DO2 should be increased by increasing ECMO flow or by transfusing the patient, and after these interventions, a new workshop evaluation should be performed. The patient does not yet show signs of cardiac recovery, as his native CO remains low (confirmed by both echocardiography and Swan-Ganz), and arterial PaO2 is very high (>200 mmHg), suggesting that mixing in the native lung is minimal, which correlates with decreased native CO.
Conclusions
ECLS, especially ECMO, has been established as a vital tool in the management of patients with acute respiratory and circulatory failure. This technology allows mechanical support of cardiac and pulmonary functions, reducing the need for additional invasive treatments and protecting the lungs during recovery. Blood gas analysis is of utmost importance for monitoring and adjusting ECMO therapy, as it provides essential information about the balance between oxygen delivery and consumption. Precise measurement of oxygen content (CaO2, CvO2, CpO2) and CO allows effective evaluation of the patient’s hemodynamic status and guides therapeutic interventions. In the clinical cases reviewed, it was observed that an adequate DO2/VO2 ratio and continuous monitoring enabled effective adjustment of ECMO support. The first patient showed an adequate balance, while the second patient required adjustments in ECMO flow due to insufficient oxygen delivery and a low DO2/VO2 ratio. Blood gas analysis is crucial in optimizing the management of critically ill patients on ECMO, ensuring adequate support and improving the chances of recovery.
Funding
This work received no sponsorship.
Conflicts of interest
The authors declare no conflicts of interest.
Ethical considerations
Protection of people and animals. The authors declare that no experiments were conducted on humans or animals for this research.
Confidentiality, informed consent, and ethical approval. The study does not involve personal patient data or require ethical approval. SAGER guidelines do not apply.
Statement on the use of artificial intelligence. The authors declare that they did not use any type of generative artificial intelligence for writing this manuscript.
