Introduction
Tuberculosis (TB) remains the leading cause of death from a single infectious agent, with an estimated 1.5 million deaths by 2020. In 2023, Mexico reported an incidence of 29 TB cases per 100,000 inhabitants according to the World Health Organization1. State-level rates per 100,000 inhabitants included: Baja California 47.92, Sonora 38.35, Chihuahua 33.68, and Zacatecas 21.312,3.
Although national epidemiologic platforms exist, Mexico lacks systematized and updated data on TB prevalence, its association with clinical and epidemiologic variables, relevant comorbidities, and patient outcomes over the last five years. Situational epidemiological data enable the characterization of patients within a geographic area and the estimation of contacts and potential transmission chains for follow-up. Identifying risk factors for TB development in representative studies helps pinpoint individuals more likely to develop disease and supports preventive measures and timely clinical diagnosis.
Zacatecas, a state in North-Central Mexico, has accounted for approximately 10% of annual TB cases in the last five years, nearly doubling prior reports4. Understanding factors associated with increased dissemination and delineating survival and characteristics that contribute to adverse outcomes is therefore relevant.
The present study aimed to identify epidemiologic factors associated with TB, clinical outcomes, and survival among patients receiving care in the IMSS system in Zacatecas during 2019-2023.
Material and methods
A retrospective cohort was conducted to determine five-year survival and mortality predictors in TB, following authorization by the IMSS Local Health Research and Ethics Committee (registration R-2024-3301-031). We identified all adult patients (≥ 18 years) who received care for TB in IMSS Zacatecas between January 2019 and December 2023. Inclusion required at least one clinical specimen with positive culture for mycobacteria or a positive nucleic acid amplification test (GeneXpert). Specimens included sputum, cerebrospinal fluid, peritoneal (ascites) fluid, urine, and surgical tissues (e.g., lymph nodes, intestinal mucosa) with granulomas positive on Ziehl-Neelsen staining. Patients with incomplete clinical records or no follow-up were excluded.
Of 145 initial cases, 25 were excluded due to nonspecific clinical data or missing confirmatory laboratory or imaging studies. The final sample comprised 125 patients with up to five years of follow-up (mean 32 months; range 1-65 months). Primary outcomes were complications and death. Survival was assessed for all patients, identifying 22 deaths versus 103 survivors, and the time from disease onset to last evaluation was used to compute survival estimates.
Categorical variables were analyzed by survival status and contrasted with sociodemographic and clinicopathologic characteristics. Descriptive statistics were generated. Normality was assessed to determine the use of dispersion measures or frequencies/percentages. For categorical variables, relative risks (RRs) were calculated; for numerical variables, Student’s t-test or nonparametric equivalents were applied as appropriate. Survival was analyzed with Kaplan-Meier methods, and factors associated with survival were evaluated using Cox proportional hazards regression. A two-sided p value < 0.05 was considered statistically significant. Analyses were performed with SPSS v25.
Results
Descriptive characteristics
Among 125 patients, 54.4% were men; the mean age was 47.5 ± 18.5 years. Employment was reported by 51.2%; 44.8% had medium-to-low socioeconomic status, and 35.2% low status. Most cases were from the state capital (43.2%) and the conurbation municipality of Guadalupe (36%).
Relevant exposures included smoking (24%), alcoholism (17.6%), biomass exposure (8%), mining exposure (5.6%), illicit drug use (4.8%), prior TB (4.8%), household contact with TB (3.2%), and overcrowding (2.4%) (Table 1).
Table 1. Diagnostic conditions and clinical background in IMSS TB patients in Zacatecas (2019-2023)
| Conditions | Defuntion | RR | IC 95% | ||
|---|---|---|---|---|---|
| Total (n = 125) frequencies (%) | Yes (n = 22) frequencies (%) | No (n = 103) frequencies (%) | Inferior/superior | ||
| Overcrowding | 3 (2.4) | 3 (13.6) | 0 (0.0) | 6.421 | 4.247-9.705 |
| Exposure to biomass | 10 (8.0) | 3 (13.6) | 7 (6.8) | 2.165 | 0.513-9.132 |
| Exposure to mine | 7 (5.6) | 1 (4.5) | 6 (5.8) | 0.770 | 0.087-6.735 |
| Contact to a TB case | 4 (3.2) | 0 (0.0) | 4 (3.9) | 1.222 | 1.123-1.329 |
| Alcoholism | 22 (17.6) | 8 (36.4) | 14 (13.6) | 3.633 | 1.289-10.23 |
| Smoking | 30 (24.0) | 12 (54.5) | 18 (17.5) | 5.667 | 2.124-15.11 |
| Drug | 6 (4.8) | 2 (9.1) | 4 (3.9) | 2.475 | 0.424-14.44 |
| Previous Tuberculosis | 6 (4.8) | 0 (0.0) | 6 (5.8) | 1.227 | 1.126-1.336 |
| Diabetes | 27 (21.6) | 6 (27.3) | 21 (20.4) | 1.464 | 0.510-4.199 |
| Human Immunodeficiency Virus (HIV) | 7 (5.6) | 2 (9.1) | 5 (4.9) | 1.960 | 0.354-10.82 |
| Hypertension (HTN) | 33 (26.4) | 6 (27.3) | 27 (26.2) | 1.056 | 0.374-2.974 |
| Rheumatoid Arthritis (RA) | 10 (8.0) | 1 (4.5) | 9 (8.7) | 0.497 | 0.059-4.141 |
| Chronic Obstructive Pulmonary Disease (COPD) | 7 (5.6) | 2 (9.1) | 5 (4.9) | 1.960 | 0.354-10.82 |
| Chronic Kidney Disease (CKD) | 3 (2.4) | 0 (0.0) | 3 (2.9) | 1.220 | 1.122-1.325 |
| Malnutrition | 10 (8.0) | 5 (22.7) | 5 (4.9) | 5.765 | 1.506-22.06 |
| Neoplasms/Cancers | 5 (4.0) | 0 (0.0) | 5 (4.9) | 1.224 | 1.124-1.332 |
| Depression | 6 (4.8) | 2 (9.1) | 4 (3.9) | 2.475 | 0.424-14.44 |
| Metabolic Disorder/Poor metabolic control | 9 (7.2) | 0 (0.0) | 9 (8.7) | 1.234 | 1.130-1.347 |
| Immunosuppression | 11 (8.8) | 3 (13.6) | 8 (7.8) | 1.875 | 0.455-7.721 |
| Treatment for hypertension | 34 (27.2) | 6 (27.3) | 28 (27.2) | 1.004 | 0.357-2.824 |
| Treatment with insuline | 6 (4.8) | 3 (13.6) | 3 (2.9) | 5.263 | 0.987-28.06 |
| Treatment with corticoesteroids | 11 (8.8) | 4 (18.2) | 7 (6.8) | 3.048 | 0.807-11.49 |
| Treatment with biologics | 8 (6.4) | 1 (4.5) | 7 (6.8) | 0.653 | 0.076-5.594 |
| Treatment with antidepressants | 4 (3.2) | 2 (9.1) | 2 (1.9) | 5.050 | 0.671-37.98 |
| Hemodialysis | 3 (2.4) | 0 (0.0) | 3 (2.9) | 1.220 | 1.122-1.325 |
| BCG | 106 (84.8) | 16 (72.7) | 90 (87.4) | 0.385 | 0.127-1.161 |
| New patient | 116 (92.8) | 19 (86.4) | 97 (94.2) | 0.392 | 0.090-1.704 |
| Time window of care more to 6 months | 22 (17.6) | 1 (4.5) | 21 (20.4) | 0.186 | 0.023-1.462 |
| Time window of diagnosis more to 6 months | 23 (18.4) | 2 (9.1) | 21 (20.4) | 0.390 | 0.084-1.804 |
| Pulmonary localization | 47 (37.6) | 7 (31.8) | 40 (38.8) | 0.735 | 0.275-1.959 |
| Mixed Localizacion | 12 (9.6) | 3 (13.6) | 9 (8.7) | 1.649 | 0.408-6.664 |
| Osea | 3 (2.4) | 1 (4.5) | 2 (1.9) | 2.405 | 0.208-27.75 |
| Miliar | 5 (4.0) | 3 (13.6) | 2 (1.9) | 7.974 | 1.247-50.97 |
| Intestinal/peritoneal | 16 (12.8) | 3 (13.6) | 13 (12.6) | 1.093 | 0.283-4.214 |
| Meningeal/SNC | 12 (9.6) | 5 (22.7) | 7 (6.8) | 4.034 | 1.146-14.19 |
| Genitourinary | 5 (4.0) | 0 (0.0) | 5 (4.9) | 1.224 | 1.124-1.332 |
| Ganglionary | 25 (20.0) | 1 (4.5) | 24 (23.3) | 0.157 | 0.020-1.226 |
| Initiation of treatment | 108 (86.4) | 12 (54.5) | 96 (93.2) | 0.088 | 0.028-0.272 |
| Monoresistence (rifampicin resistance by GenXpert) | 6 (4.8) | 4 (18.2) | 2 (1.9) | 11.222 | 1.911-65.87 |
*For each variable the data represents 125 patients. BCG: Application of Calmette-Guerin vaccine.
Comorbidities included systemic arterial hypertension (26.4%), diabetes mellitus (21.6%), iatrogenic immunosuppression (8.8%), rheumatoid arthritis (8%), malnutrition (8%), metabolic disorder (7.2%), COPD (5.6%), HIV (5.6%), depression (4.8%), neoplasia (4%), and chronic kidney disease (2.4%). Additional comorbidities (0.8% each) were idiopathic hepatitis, anemia, Crohn’s disease, spondylitis, cystic fibrosis, glucose intolerance, systemic lupus erythematosus, follicular non-Hodgkin lymphoma, Down Syndrome, and pulmonary thromboembolism (Table 1).
The cohort’s mean follow-up was 32 months (range 1-65). Clinical features at diagnosis are summarized in Table 1 and clinical patterns in Table 2 (both stratified by death status). Vital and laboratory scales appear in table 3, and clinical course and complications in table 4.
Table 2. Clinical pattern in IMSS TB patients in Zacatecas (2019-2023)
| Clinical pattern | Defuntion | RR | IC 95% | ||
|---|---|---|---|---|---|
| Total (n = 125) frequencies (%) | Yes (n = 22) frequencies (%) | No (n = 103) frequencies (%) | Inferior/superior | ||
| Seizures | 4 (3.2) | 3 (13.6) | 1 (1.0) | 16.105 | 1.589-163.1 |
| Neck stiffness | 8 (6.4) | 5 (22.7) | 3 (2.9) | 9.804 | 2.142-44.86 |
| Disorientation | 15 (12.0) | 8 (36.4) | 7 (6.8) | 7.837 | 2.459-24.97 |
| Tremor | 21 (16.8) | 9 (40.9) | 12 (11.7) | 5.250 | 1.852-14.87 |
| Asthenia | 91 (72.8) | 20 (90.9) | 71 (68.9) | 4.507 | 0.993-20.44 |
| Lethargy | 18 (14.4) | 7 (31.8) | 11 (10.7) | 3.903 | 1.307-11.64 |
| Muscle weakness | 42 (33.6) | 13 (59.1) | 29 (28.2) | 3.686 | 1.422-9.551 |
| Stupor | 13 (10.4) | 5 (22.7) | 8 (7.8) | 3.493 | 1.020-11.95 |
| Fever | 76 (60.8) | 18 (81.8) | 58 (56.3) | 3.491 | 1.104-11.04 |
| Pleural effusion | 9 (7.2) | 2 (9.1) | 7 (6.8) | 3.095 | 0.681-14.05 |
| Drowsiness | 29 (23.2) | 9 (40.9) | 20 (19.4) | 2.873 | 1.078-7.656 |
| Weight loss | 83 (66.4) | 18 (81.8) | 65 (63.1) | 2.631 | 0.828-8.349 |
| Dyspnea | 19 (15.2) | 6 (27.3) | 13 (12.6) | 2.596 | 0.860-7.829 |
| Dry cough | 75 (60.0) | 16 (72.7) | 59 (57.3) | 2.346 | 0.909-6.047 |
| Hemoptysis | 37 (29.6) | 10 (45.5) | 27 (26.2) | 2.165 | 0.513-9.132 |
| Vomiting | 10 (8.0) | 3 (13.6) | 7 (6.8) | 2.063 | 0.739-5.756 |
| Weakness | 26 (20.8) | 7 (31.8) | 19 (18.4) | 1.989 | 0.719-5.494 |
| Headache | 50 (40.0) | 11 (50.0) | 39 (37.9) | 1.641 | 0.650-4.141 |
| Paralysis | 1 (0.8) | 0 (0.0) | 1 (1.0) | 1.216 | 1.120-1.319 |
| Abdominal pain | 5 (4.0) | 1 (4.5) | 4 (3.9) | 1.179 | 0.125-11.08 |
| Sweating | 59 (47.2) | 11 (50.0) | 48 (46.6) | 1.146 | 0.456-2.878 |
| Adenopathy | 37 (29.6) | 7 (31.8) | 30 (29.1) | 1.044 | 0.209-5.206 |
| Nausea | 34 (27.2) | 6 (27.3) | 28 (27.2) | 1.004 | 0.357-2.824 |
| Hyporexia | 55 (44.0) | 9 (40.9) | 46 (44.7) | 0.858 | 0.336-2.183 |
| Productive cough | 50 (40.0) | 8 (36.4) | 42 (40.8) | 0.830 | 0.319-2.153 |
| Other | 21 (16.8) | 1 (4.5) | 20 (19.4) | 0.198 | 0.025-1.557 |
For each variable the data represents 125 patients.
Table 3. Vital and laboratory scales in IMSS TB patients in Zacatecas (2019-2023)
| Scale | Score | Average (SD) |
|---|---|---|
| Respiratory frequency | – | 19.9 (3.3) |
| Mean Arterial Tension | – | 113.6 (17.8) |
| Leukocytes (x1000) | – | 8 (4.4) |
| Lymphocytes (x1000) average | – | 4.8 (8.2) |
| Neutrophils | – | 20.1 (2.8) |
| Hb | – | 12.6 (2.6) |
| Platelets | – | 326 (110) |
| Red cells | – | 4.5 (0.8) |
| GOT | – | 45.3 (5.8) |
| GPT | – | 30.3 (12.9) |
| Cholesterol | – | 177.6 (106.2) |
| HDL | – | 43.3 (14.6) |
| Creatinine | – | 1.1 (1.4) |
| Urea | – | 40.5 (34.5) |
| NLR | – | 6.9 (7.7) |
| Glasgow | – | 15 (2.1) |
| QSOFA | 0 | 107 (85.6%) |
| 1 | 8 (6.4%) | |
| 2 | 2 (1.6%) |
RR: respiratory rate; MAT: mean arterial blood pressure; Hb: hemoglobin; GOT: glutamic oxaloacetic transaminase; GPT: glutamic-pyruvic transaminase; HDL: high-density lipoprotein; NLR: neutrophils/lymphocytes; QSOFA: quick sepsis organ failure assessment (QSOFA 2-3).
Table 4. Clinical evolution of TB patients in IMSS in Zacatecas (2019-2023)
| Condition | Subcondition | n (%) |
|---|---|---|
| Complications | – | 61 (48.8%) |
| Immunological complications | – | 3 (2.4%) |
| Urogenital complications | – | 4 (3.2%) |
| Cardiac complications | – | 1 (0.8%) |
| GI complications | – | 17 (13.6%) |
| Respiratory complications | – | 17 (13.6%) |
| CNS complications | Motor signs | 11 (8.8%) |
| Occlusion of the central retinal vein of the left eye | 1 (0.8%) | |
| Flaccid paraparesis | 1 (0.8%) | |
| Psychosis | 1 (0.8%) | |
| CNS vasculitis/hemiplegia | 1 (0.8%) | |
| AKI | – | 21 (16.8%) |
| Septic Shock | – | 10 (8%) |
| Pleural effusion | – | 8 (6.4%) |
| Death | – | 22 (17.6%) |
GI: gastrointestinal; CNS: central nervous system; AKI: acute kidney injury.
Common chest radiograph findings were miliary pattern (16%), pulmonary fibrosis (7.3%), consolidation (7.4%), cavitation (6.4%), pulmonary nodules (3.2%), tuberculoma (2.4%), and atelectasis (1.6%); pneumothorax, bronchiectasis, empyema, and bullae were each 0.8%. Computed tomography (CT) was performed in 12% of patients; characteristic patterns included consolidation (1.6%), ground-glass opacities (1.6%), cavitation and tree-in-bud pattern (2.4%), miliary pattern (1.6%), and nodules (1.6%).
The cohort’s mortality rate was 17.6% (Table 4).
Risk factors associated with death
In logistic regression, demographic and exposure factors associated with higher risk of death included overcrowding (RR 6.4; 95% CI 4.247-9.705), smoking (RR 5.6; 95% CI 2.124-15.11), alcoholism (RR 3.6; 95% CI 1.289-10.23), previous TB (RR 1.2; 95% CI 1.126-1.336) and contact with a TB case (RR 1.22; 95% CI 1.123-1.329) (Table 1).
Comorbidities and treatments associated with increased risk of death were chronic kidney disease (RR 1.22; 95% CI 1.122-1.325), malnutrition (RR 5.7; 95% CI 1.506-22.06), neoplasia (RR 1.22; 95% CI 1.124-1.332), metabolic disorder (RR 1.23; 95% CI 1.130-1.347), and hemodialysis (RR 1.22; 95% CI 1.122-1.325) (Table 1).
Diagnostic factors associated with risk of death were miliary localization (RR 7.9; 95% CI 1.247-50.97), meningeal/CNS localization (RR 4.03; 95% CI 1.146-14.19), and rifampicin-resistant Mycobacterium tuberculosis (RR 11.22; 95% CI 1.911-65.87) (Table 1).
Clinical manifestations associated with death included seizures (RR 16.1; 95% CI 1.589-163.1), neck stiffness (RR 9.8; 95% CI 2.142-44.86), disorientation (RR 7.8; 95% CI 2.459-24.97), tremor (RR 5.25; 95% CI 1.85-14.87), lethargy (RR 3.90; 95% CI 1.30-11.64), muscle weakness (RR 3.68; 95% CI 1.42-9.55), fever (RR 3.49; 95% CI 1.10-11.04), stupor (RR 3.49; 95% CI 1.02-11.95), drowsiness (RR 2.87; 95% CI 1.07-7.65), and paralysis (RR 1.21; 95% CI 1.120-1.319) (Table 2).
Radiologic findings associated with increased risk of death were pneumothorax (RR 6.1; 95% CI 4.08-9.10), bronchiectasis (RR 5.9; 95% CI 3.99-8.71), empyema (RR 5.9; 95% CI 3.99-8.71), consolidation (RR 4.51; 95% CI 1.10-18.54), miliary pattern (RR 4.33; 95% CI 1.50-12.46), pulmonary nodules (RR 1.22; 95% CI 1.12-1.32), tuberculoma (RR 1.22; 95% CI 1.122-1.32), atelectasis (RR 1.21; 95% CI 1.12-1.32), and bullae (RR 1.21; 95% CI 1.12-1.31).
Severity and complication indices associated with increased risk of death were NLR ≥ 10 (RR 10.44; 95% CI 3.54-30.75), Quick Sepsis Organ Failure Assessment (QSOFA 2-3) (RR 6.15; 95% CI 4.11-9.18), any complication (RR 15.12; 95% CI 3.35-68.18), gastrointestinal complications (RR 4.34; 95% CI 1.43-13.15), respiratory complications (RR 4.34; 95% CI 1.43-13.15), and acute kidney injury (RR 3.95; 95% CI 1.39-11.25).
Survival analysis
Stepwise logistic regression identified independent risk variables for death: rifampicin-resistant M. tuberculosis (RR 141.31; 95% CI 8.75-2280.86; p = 0), seizures (RR 132.31; 95% CI 7.61-2299.87; p = 0.001), NLR ≥ 10 points at diagnosis (RR 47.68; 95% CI 8.04-282.68; p = 0), miliary TB (RR 16.14; 95% CI 1.048-248.74; p = 0.046), and alcoholism (RR 8.74; 95% CI 1.4-54.50; p = 0.020).
Kaplan-Meier analysis showed 74.3% survival at 32 months for the entire cohort (Supplementary Figure S1). Cox regression models estimated survival for significant risk factors (Figure 1): among rifampicin-resistant cases, 33% had survival time < 20 months, versus 76.67% 5-year survival in rifampicin-susceptible cases (p < 0.001). For NLR ≥ 10, 17% had survival time < 40 months, compared with 85.46% survival beyond 60 months in those without elevated NLR (p < 0.001). Among patients with miliary TB, 30% had survival time < 20 months, versus 76.13% survival beyond 60 months in non-miliary TB (p = 0.046). In the group of patients consuming alcohol, 57.7% had survival of 30 months, versus 78.31% survival beyond 60 months in non-alcohol-consuming subjects (p = 0.020). The Cox model is detailed in the supplementary material.
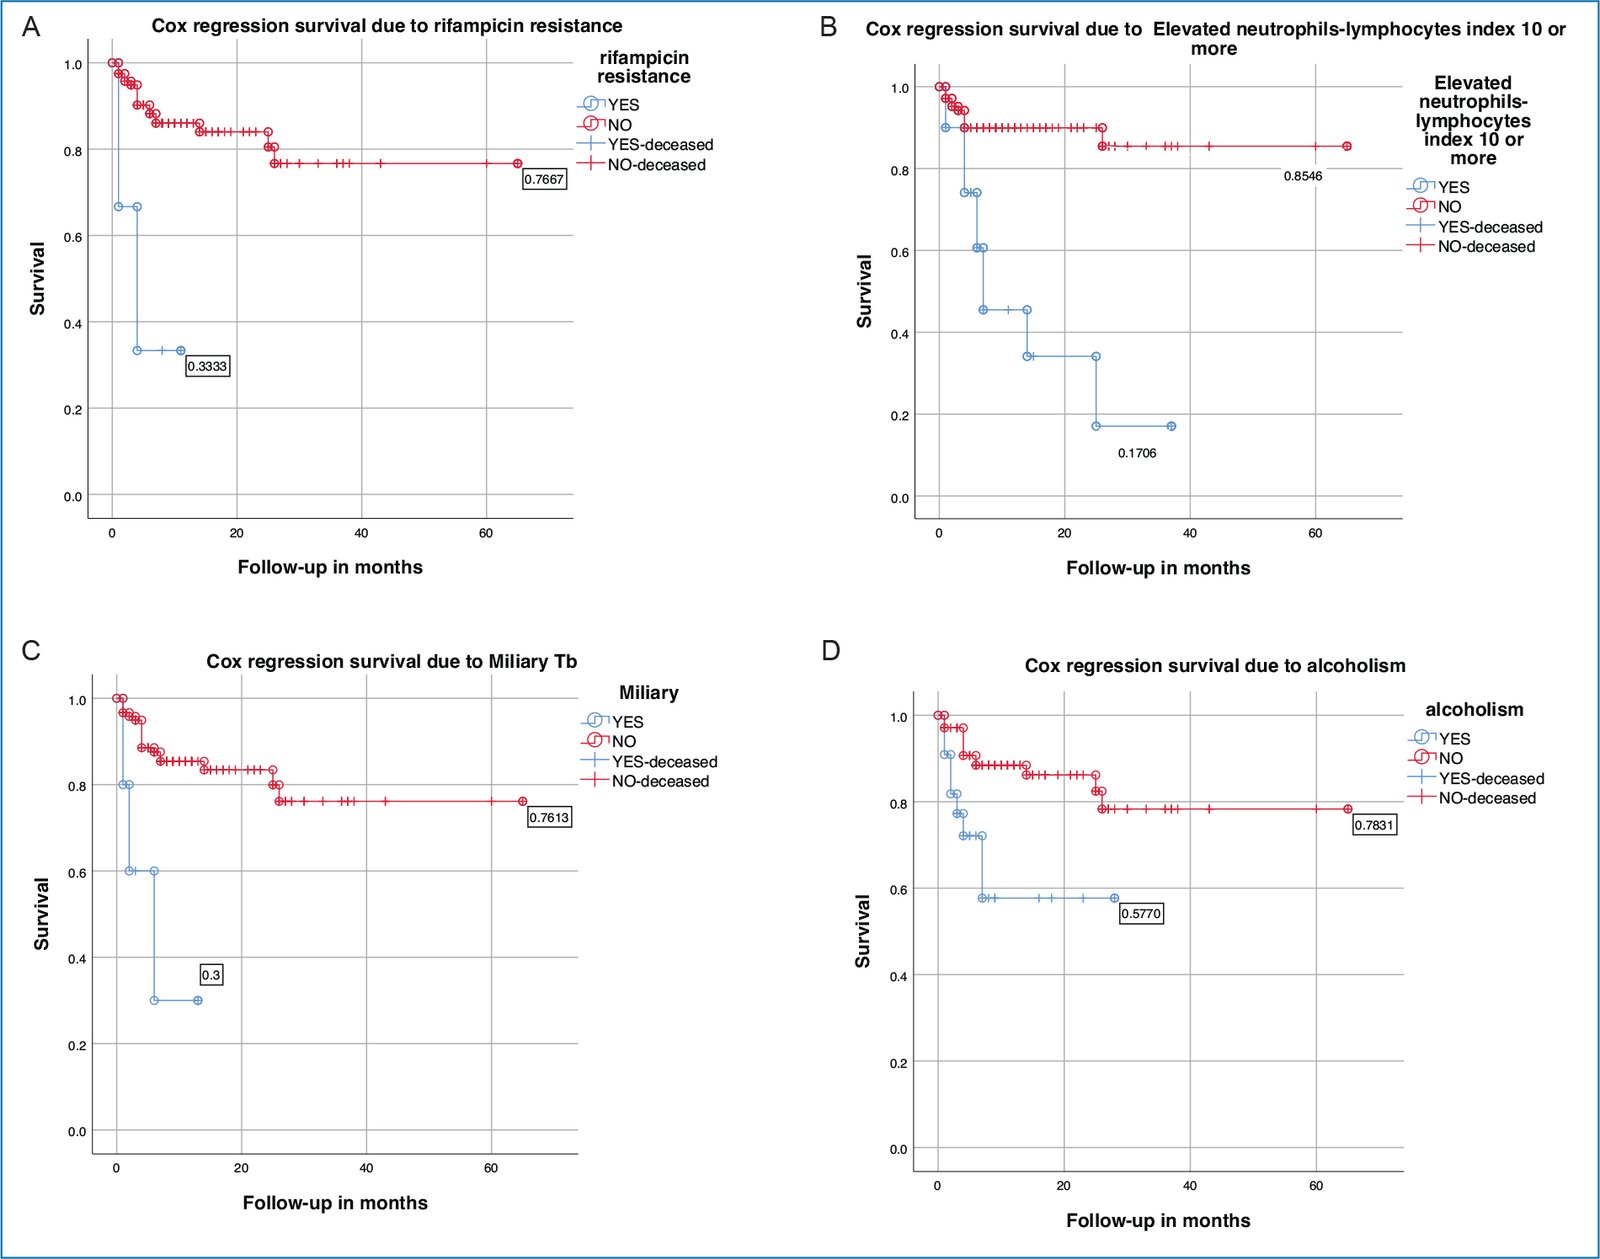
Figure 1. Cox regression model. Survival estimation according to risk factors identified in the logistic regression. The effect of each variable on mortality is shown. A: rifampicin resistance; B: high INL; C: miliary localization; D: alcoholism. Using a cut-off point of 60 months of evolution, the percentage of cases surviving in each comparison scenario is shown.
Discussion
Despite advances in TB control, an estimated 8 million people develop TB annually, and almost 2 million die5. Approximately one-quarter of the global population is infected with Mycobacterium tuberculosis, with 5-10% developing active disease in their lifetime; risk of reactivation is strongly influenced by immune status.
As shown in the present work, epidemiologic characteristics of TB in Zacatecas parallel national and global patterns: malnutrition, aging, diabetes, alcohol use disorders, and smoking independently or as comorbidities increase TB progression6–9. Mexico ranks third in Latin America for pulmonary and extrapulmonary TB (EPTB). The most affected age group is between 15 and 45 years, with higher mortality among older adults and additional risk with comorbidities10,11. Hospital series in Mexico report predominance of pulmonary TB, frequent HIV co-infection in some settings, and meningeal TB among EPTB presentations12–14. In contrast, our cohort included 37% pulmonary TB, with extrapulmonary forms decreasing in prevalence across lymph node, intestinal, meningeal/CNS, genitourinary, and miliary involvement.
Drug resistance was detected in 4.8% of cases, lower than reports from other Mexican regions6,15. Comorbidities in this cohort included systemic arterial hypertension most frequently, followed by diabetes and others; diabetes (21.6%) and HIV (5.6%) were comparable to external reports. Tuberculosis-diabetes comorbidity appears more prevalent than TB-HIV in our setting, consistent with global trends16.
Demographic and behavioral factors linked to death included overcrowding, alcoholism, and smoking – aligned with evidence that tobacco and alcohol increase recurrence, relapse, and mortality risk during treatment, with synergistic adverse effects17,18.
Malnutrition at least doubled the risk of death, concordant with literature associating undernutrition with two- to fourfold mortality increases in TB19. Our survival analysis showed heightened risk with alcoholism, NLR ≥ 10 at diagnosis, miliary TB, and rifampicin resistance; seizures were close to significance in survival models.
Consistent with our report, in Tamaulipas (Northeast Mexico) a multivariate logistic regression showed that in older adults (≥ 65 years) compared to young (18-39 years) and middle-aged adults (40-64 years), alcohol excess increased the risk of death during TB treatment20. According to TB post-treatment mortality rates (2008-2019) in Georgia, USA, multivariate analysis reported increased risk of mortality due to excess alcohol21. Meta-analysis shows that alcohol consumption increases the risk of treatment failure and death in both drug-sensitive and multidrug-resistant TB patients22.
NLR is used for monitoring, stratification, and prognosis of various clinical syndromes and diseases. A common surrogate of inflammation and stress, it connects immune, endocrine, and autonomic nervous system function. A meta-analysis proposed NLR to discriminate TB and community-acquired bacterial pneumonia since TB patients presented lower levels23. In newly diagnosed rifampicin-sensitive pulmonary TB, NLR decreased in patients responding to drug treatment (sputum negative in two months). The authors proposed this index/ratio to monitor response to treatment24. In the present work, for the first time, NLR ≥ 10 is reported to be associated with a higher risk of death from TB.
CNS TB carries high morbidity and mortality; manifestations may be nonspecific and include seizures and hydrocephalus. Miliary TB reflects hematogenous dissemination with concurrent pulmonary and extrapulmonary disease and high risk of tuberculous meningitis25–30. Given our findings, underdiagnosis of CNS TB is plausible: among patients with seizures at diagnosis, meningeal and miliary forms were present and associated with death in several cases.
Globally, rifampicin-resistant, and multidrug-resistant TB remain substantial contributors to mortality31. Mexico is among the five countries with the highest number of TB and MDR-TB cases in Latin America. Our cohort’s risk associated with rifampicin resistance was marked, without clear clustering of specific comorbidities, underscoring the need for prompt identification and appropriate therapy.
Conclusions
Epidemiologic factors associated with TB in Zacatecas mirror national patterns, with a higher frequency of EPTB. The risk of death increased in patients with alcoholism, NLR ≥ 10 at diagnosis, miliary TB, and rifampicin resistance. These findings emphasize the importance of counseling regarding alcohol use and adherence to antimicrobial therapy.
NLR may be useful as a predictor of poor outcomes in TB, complementing its previously reported performance as a treatment-monitoring biomarker.
In view of potential underdiagnosis of meningeal TB, routine screening for CNS involvement should be considered when miliary TB is present, using PCR or high-throughput sequencing in cerebrospinal fluid when feasible.
Identifying risk factors for poor survival provides a foundation for preventive strategies to improve survival among patients with TB.
Funding
No funding agency had any role in the study design, data collection and analysis, decision to publish, or preparation of the manuscript.
Conflicts of interests
The authors declare that they have no known competing financial interests or personal relationships that could have appeared to influence the work reported in this paper.
Ethical considerations
Protection of humans and animals. The authors declare that no experiments involving humans or animals were conducted for this research.
Confidentiality, informed consent, and ethical approval. The authors have obtained approval from the Ethics Committee for the analysis of routinely obtained and anonymized clinical data, so informed consent was not necessary. Relevant guidelines were followed.
Declaration on the use of artificial intelligence. The authors declare that no generative artificial intelligence was used in the writing of this manuscript.
